Research notes from a Jupyter notebook (bcms_risk_montecarlo_v2.ipynb). Most BCMS programs don't fail during the disruption — they fail much earlier, the moment the business sets an RTO and RPO the architecture cannot keep. Across 10,000 Monte Carlo runs using Beta-PERT exposure, Log-Normal MTTR and Poisson ARO, ~71% of scenarios breached the 8h RTO and ~50% breached the 4h RPO. Treatment cuts median ALE from USD 442K to USD 207K with payback in ~1.5 months.
Executive summary
- The cable matters more than the binder. A BCMS is a decision machine, not a documentation project — it turns disruption into a finite list of trade-offs: how fast must we recover, what does every hour cost, what comes back first, and how much should we spend before the next failure.
- Most BCMS programs fail before the disruption — at the moment the organisation promises an RTO and RPO the architecture cannot keep.
- The simulated Telco promised 8h RTO / 4h RPO. The architecture almost never delivered it: ~71% RTO breach overall, 97.7% in Carrier Degradation, 100% in Catastrophic.
- Median ALE without treatment: USD 442K/yr. With dual-carrier treatment: USD 207K/yr — a 53% reduction. Median net benefit: USD 235K/yr. Payback: ~1.5 months. P99 tail loss: USD 2.07M.
- Headline finding: the architecture was structurally incompatible with the business promise. Only three honest options remain — change the architecture, change the promise, or write down the risk and own it.
What this is not
A certification template, a generic risk model, or a final answer. The Beta-PERT parameters are expert-elicited, not calibrated against an incident log. The interesting work begins when a real organisation replaces the placeholder numbers with its own data.
BCMS is not (just) a binder. It is a decision machine.
Imagine a city powered by a single electric cable. As long as the cable works, life looks normal — traffic lights behave, hospitals run both a bedside lamp and a life-support machine, elevators move. Then the cable fails. The question is no longer 'do we have a policy about this?'. It becomes: how fast must power return, how much damage happens every hour before it does, which systems come back first, and how much should we spend before the next failure to stop the same chaos happening again?
That is what business continuity is supposed to do. It turns disruption into a decision problem. ISO 22301 describes BCMS as a system for continuing products and services at an acceptable, predefined capacity during disruption — not as a place to store emergency paperwork.
Why BCMS feels complicated
BCMS looks daunting because it mixes four very different worlds: operations (which services must keep running), technology (which systems support them), finance (what is the Value at Risk, and how do we justify safeguards instead of trusting our gut), and governance (who decides what is worth protecting first). Most organisations split those four worlds into different meetings, different owners, and different binders. The result is a continuity program with a lot of forms and very little informed decision-making.
That is exactly why ISO 31000 matters. It connects those four worlds with one risk logic: set the context, identify, analyse, evaluate, treat, monitor. In plain English: figure out what can hurt you, estimate how bad it could get, and only then decide what is worth fixing.
BCMS fails before the outage starts
Key insight
BCMS does not usually fail during the disruption. It fails much earlier — at the moment the business sets recovery targets without understanding the economics of failure.
In the model, a fictitious Telco depends on international connectivity for critical operations. It states it can tolerate 8 hours of downtime (RTO) and 4 hours of data loss (RPO). Those are not technical numbers — they are business promises. When the simulated outage scenarios were tested, the picture changed fast. In the current Beta-PERT model the overall breach rates are ~71% for RTO and ~50% for RPO. Inside the carrier degradation tier the RTO breach rate is still 97.7%; inside the catastrophic tier it is 100%. The continuity problem was not 'how do we recover faster?' — it was 'why did the organisation promise an 8-hour recovery when the architecture almost never supports it?'
The three numbers that make BCMS understandable
If BCMS feels confusing, strip it to three numbers: MTTR (how long recovery actually takes), RTO/RPO (what the business says it can tolerate), and ALE (what disruption costs over time). In the simulation the median MTTR was 11.7h, P90 at 41.3h, P99 at 72h (also the MTPD, where the model clips the tail). If management says the business survives only 8 hours but recovery sits closer to 12, and a bad day takes 41–72h, the continuity gap is visible before any incident occurs.
NIST SP 800-34 Rev. 1 is clear that RTO and RPO should come from the Business Impact Analysis, not guesswork by IT. They are business pain thresholds, not technical tuning knobs.
SLE = Asset Value × Exposure Factor (EF)
ALE = SLE × Annual Rate of Occurrence (ARO)
In one sentence: how much do we lose each time the disaster happens, and how often does it happen? In the scenario-based model the median annual loss without treatment was USD 442K. With dual-carrier treatment it falls to USD 207K. That is the moment BCMS earns the Board's attention.
Monte Carlo is just repeated imagination, made honest
A lot of executives hear 'Monte Carlo simulation' and think it must be mythical. It is not. It is a disciplined way to ask the same question thousands of times under slightly different conditions. The notebook built three scenario families, weighted to the NIST SP 800-34 BIA priority tiers, and sampled them with Beta-PERT distributions rather than min-mode-max triangles. Beta-PERT is more realistic because it represents skewed expert opinion instead of forcing symmetry — and real disasters are not symmetric.
| Tier | Scenario | Mix Weight | Exposure Range | MTTR Range |
|---|---|---|---|---|
| Critical | Normal Operations | 60% | 10–35% | 4–18 hours |
| Essential | Carrier Degradation | 30% | 20–55% | 12–50 hours |
| Important | Catastrophic Outage | 10% | 35–75% | 35–96 hours |
What the charts show
1. How much money are we really talking about? — ALE percentile curve
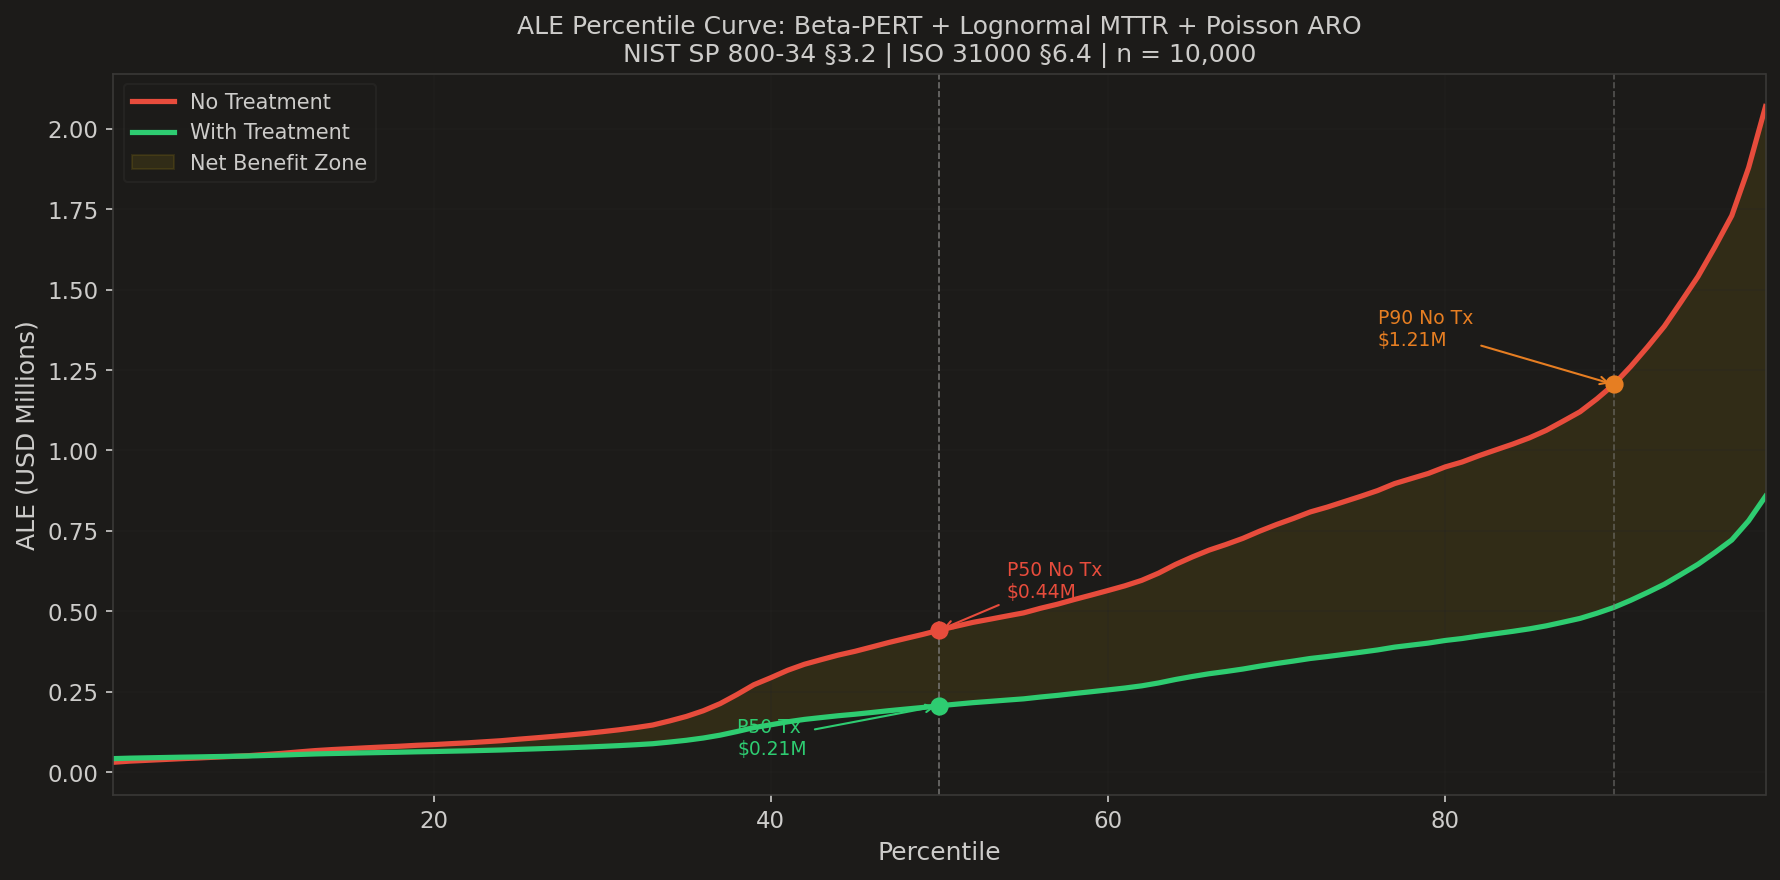
Red is the world without treatment, green is dual-carrier treatment, the yellow band is the net benefit zone. At P50 treatment cuts annual loss from USD 442K to USD 207K. At P90 the no-treatment world reaches USD 1.21M while the treated world stays near USD 512K. The further right you look, the wider the band — the value of treatment grows exactly when the year is bad. That is the opposite of how an unprotected business behaves.
2. How long does recovery actually take? — MTTR Log-Normal distribution
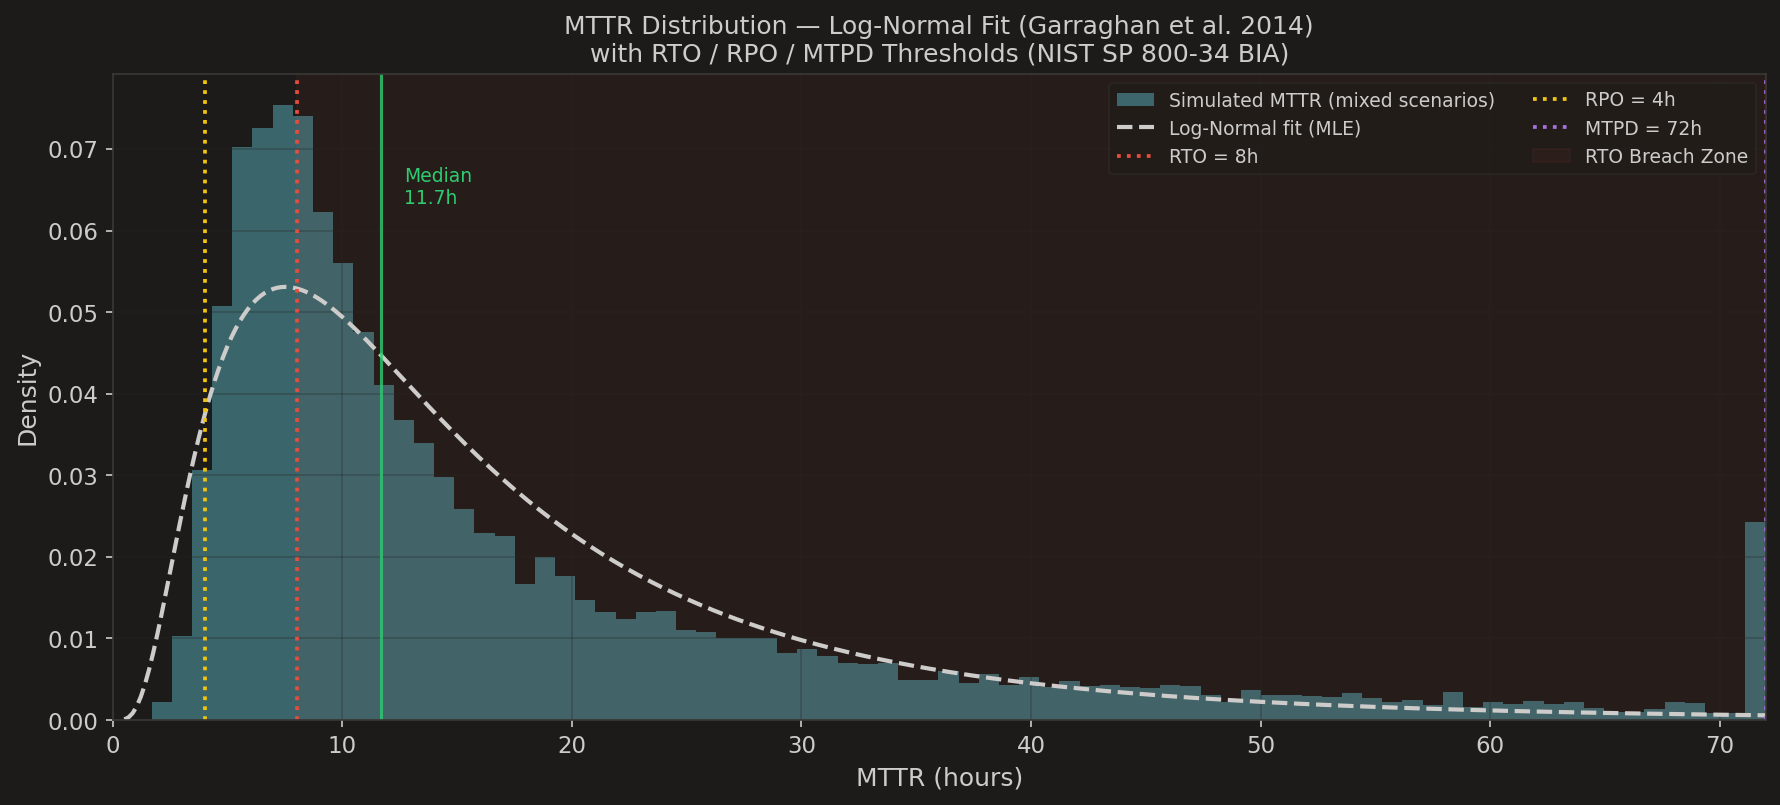
Histogram is simulated MTTR; the dashed line is the log-normal fit (Garraghan et al., 2014). Median MTTR sits at 11.7h — already past the RTO. The right tail bleeds into the red breach zone. A log-normal has a heavy right tail by design, which is why a continuity plan that targets the average outage always loses to the bad outage.
3. Which scenario tier is hurting us the most? — RTO / RPO breach by NIST tier
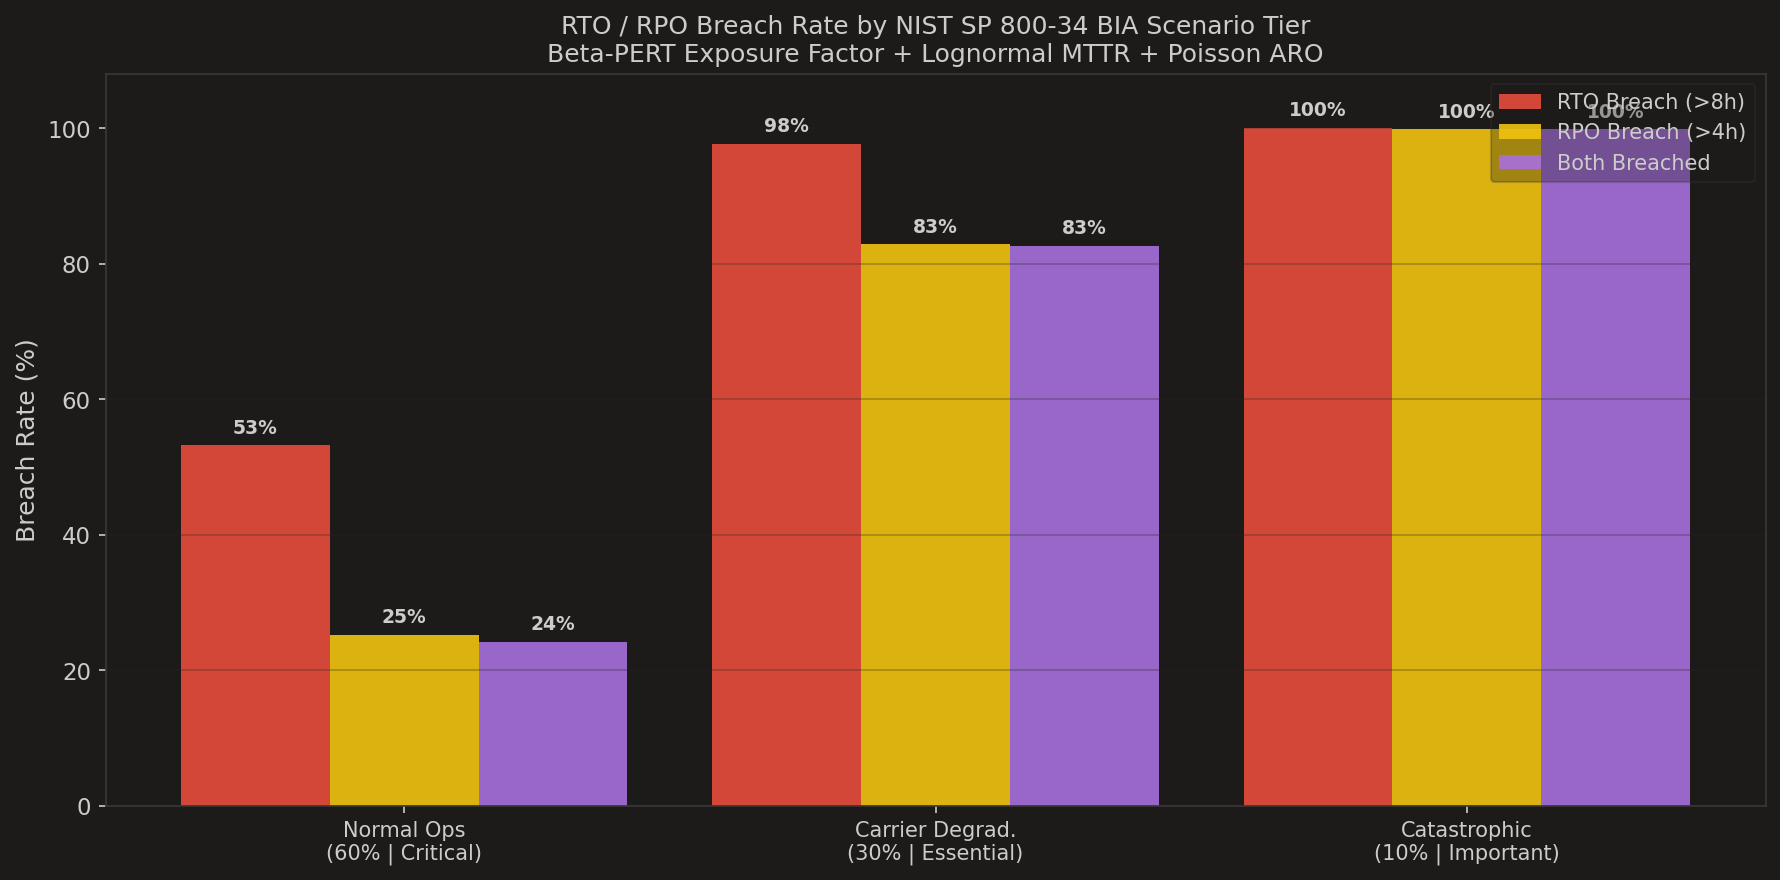
Normal Operations (60% of cases) breaches RTO 53.2% of the time and RPO 25.2%. Carrier Degradation (30%) breaches RTO 97.7% and RPO 82.8%. The Catastrophic tier (10%) is 100% for RTO and 99.8% for RPO. A continuity manager reads this chart in one second: the business promise survives only the easy day.
4. Which risks should we fix first? — Pareto risk impact
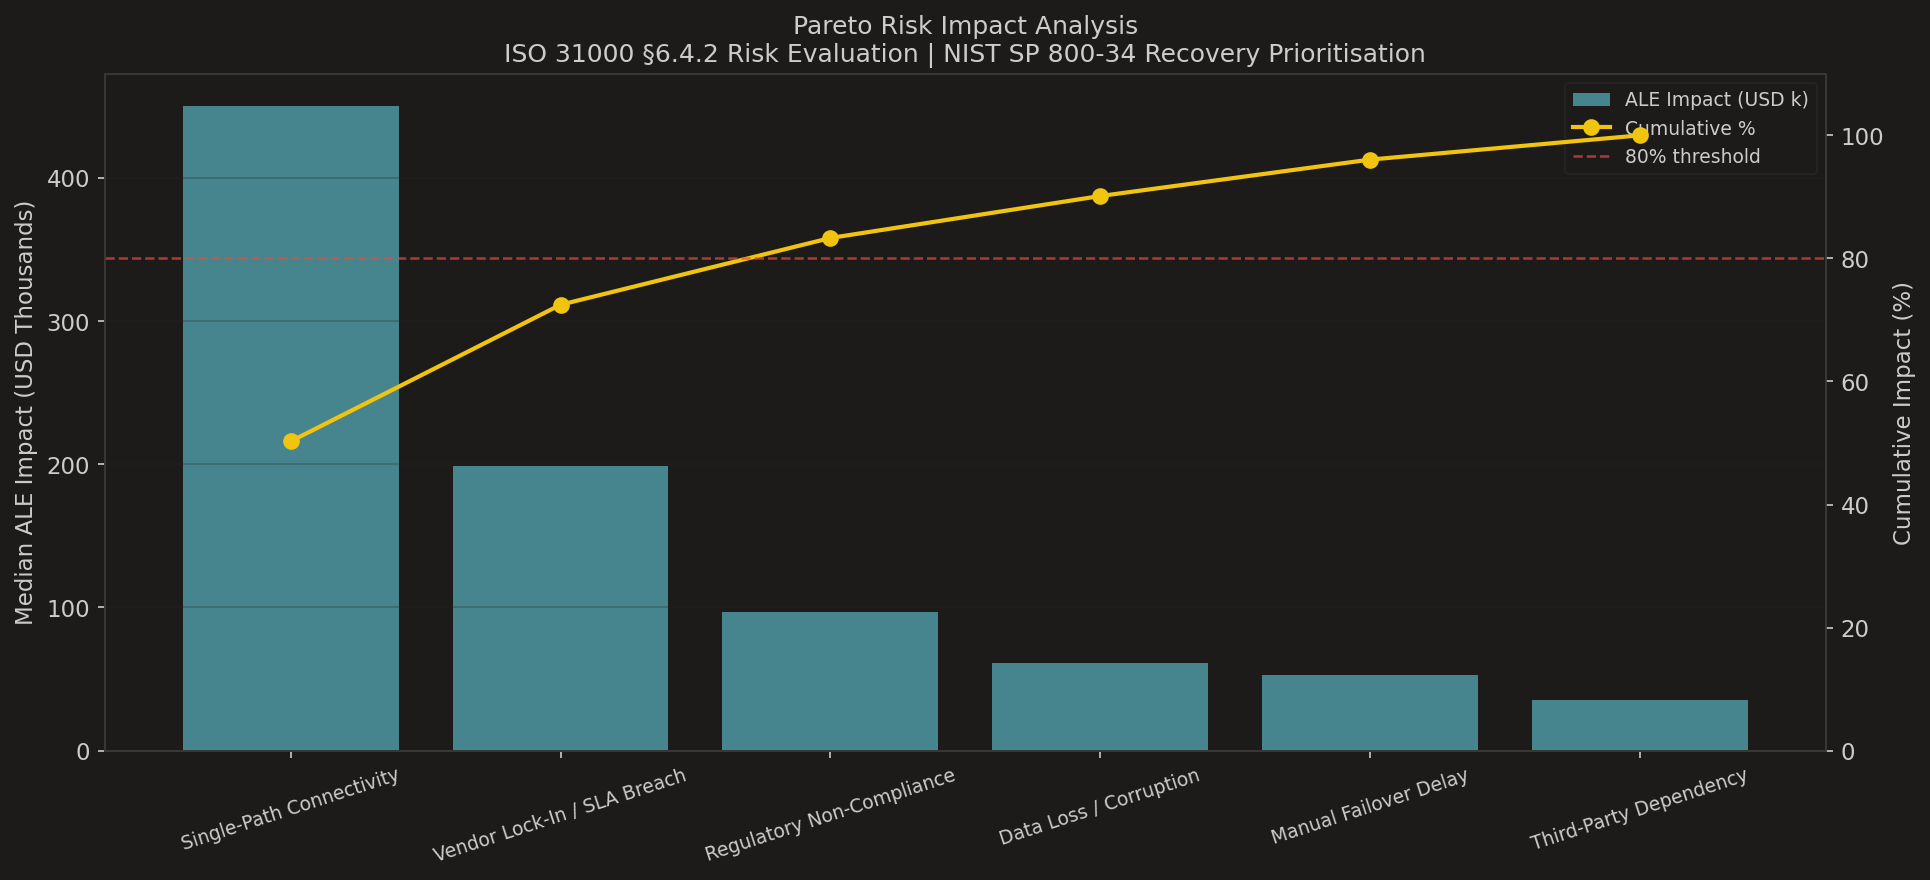
Six risks sorted by median ALE contribution; the 80% cumulative line is the prioritisation rule from ISO 31000 §6.4.2. Single-Path Connectivity and Vendor Lock-In / SLA Breach together drive most of the 80% of impact. That is where the treatment money belongs.
5. When is treatment financially obvious? — SLE vs ALE scatter
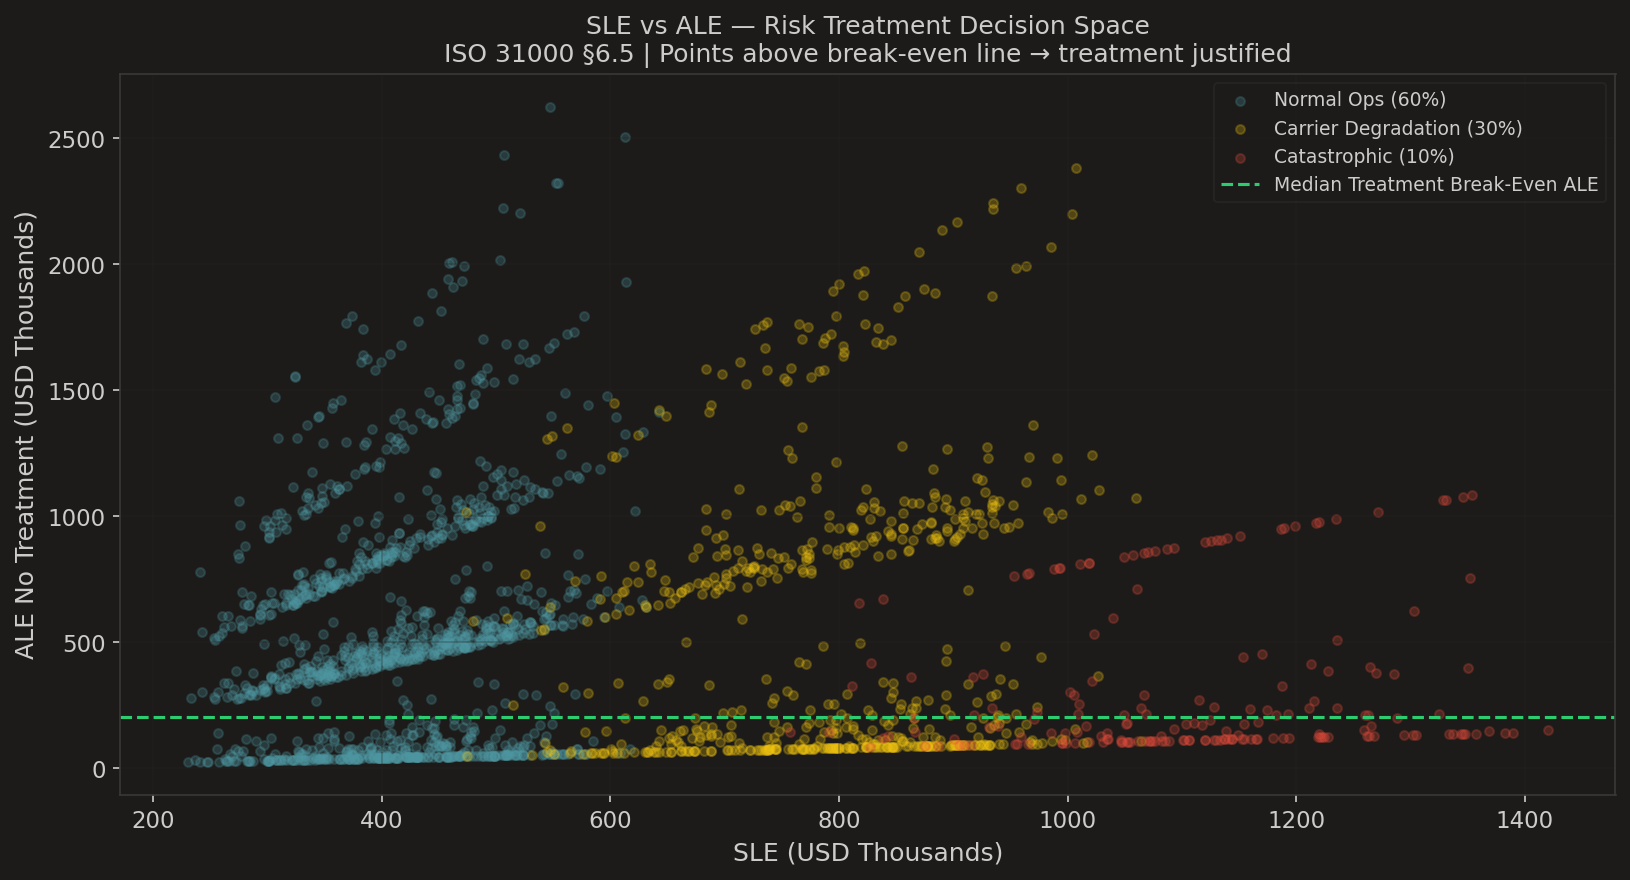
Each dot is one simulated year. The horizontal break-even line is the median ALE the business would pay with treatment (residual risk + annualised treatment cost). Every dot above is a year in which treatment was financially justified. Most dots — especially in the Carrier Degradation and Catastrophic tiers — sit comfortably above it. The decision is no longer a debate; it is a count.
6. Did we use the right distributions? — Distribution diagnostics
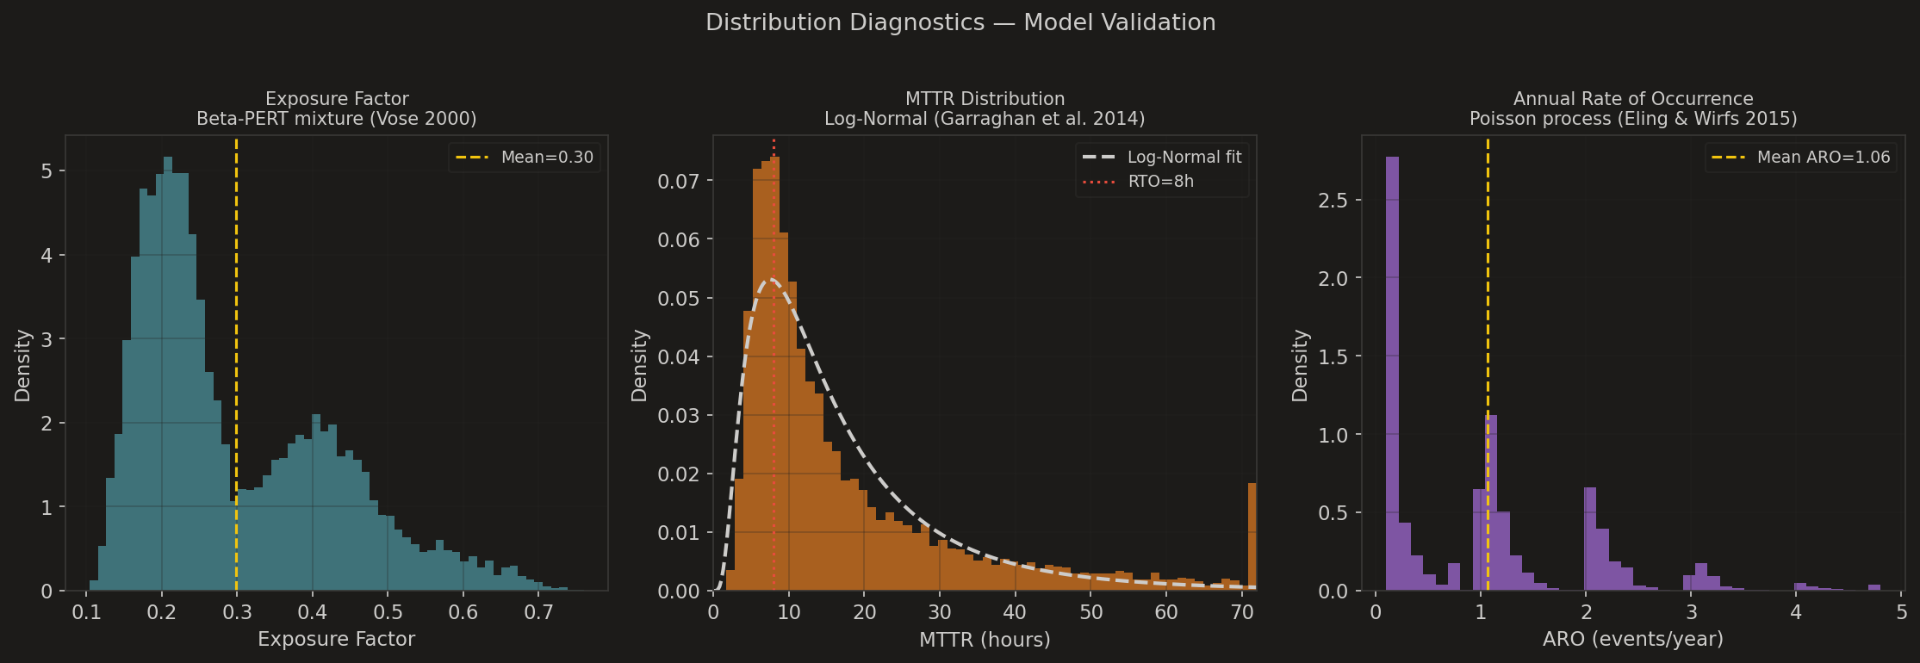
The diagnostics panel checks the three modelling assumptions: Beta-PERT for Exposure Factor (Vose, 2000), Log-Normal for MTTR (Garraghan et al., 2014), Poisson for ARO (Eling & Wirfs, 2015). The shapes are not pretty defaults — they are the shapes the literature says match real recovery and incident data. This chart is the receipt for the rest of the article.
The result that matters most
Headline finding
The architecture was structurally incompatible with the business promise. Not 'we need better documentation' — the organisation promised a recovery level its operating design almost never delivered.
Once you know that, the next steps become obvious:
- Change the architecture — dual-carrier diversity, geographically diverse routes, etc.
- Change the promise — re-baseline RTO and RPO against measured reality.
- Accept the risk honestly — and document the residual exposure on the books.
That third option is rarely the executives' favourite. It is also the most honest one when the budget for the first two is not coming.
Research caveats
This article is part of a literature review on quantitative BCMS modelling. The model is a teaching artifact, not a production-ready risk model. Active areas of improvement:
- Parameter calibration — Beta-PERT min/mode/max are expert-elicited, not pulled from an incident log. Real calibration requires a few years of structured outage data.
- Correlation between EF and MTTR — the current model assumes independence. In real systems, high-impact events often also take longer to recover.
- Scenario weights — the 60/30/10 mix is a NIST-tier convention, not a measurement. It deserves an annual review against carrier SLA performance.
- Treatment cost shape — modelled as log-normal with a fixed annualised line item. A real decision involves staged CapEx that this version does not capture.
If the parameters are wrong in your context
The qualitative conclusion (architecture vs. promise) usually still holds. The exact ALE numbers will not — replace the placeholders with your own incident log before quoting figures to the Board.
Download — notebook and Word write-up
Monte Carlo BCMS risk model — Jupyter notebook
The full notebook: Beta-PERT exposure, Log-Normal MTTR, Poisson ARO, 10,000-run scenario simulation, ALE/SLE/Pareto outputs. Free to adapt with your own incident data.
bcms_risk_montecarlo_v2.ipynb · Download IPYNB →
Monte Carlo summary statistics — CSV
Mean, std, and P10–P99 percentiles for Exposure Factor, MTTR, ARO, SLE, ALE (with/without treatment), Net Benefit and Downtime Cost across 10,000 runs.
monte_carlo_summary_v2.csv · Download CSV →
References
- NIST SP 800-34 Rev. 1 (2010). Contingency Planning Guide for Federal Information Systems.
- ISO 22301:2019. Security and Resilience — Business Continuity Management Systems.
- ISO 31000:2018. Risk Management — Guidelines.
- Vose, D. (2000). Risk Analysis: A Quantitative Guide. Wiley.
- Rees, M. (2015). Business Risk and Simulation Modelling in Practice. Wiley.
- Almog, R. (1994). Application of the Lognormal Distribution to Corrective Maintenance Repair Time. Naval Postgraduate School.
- Garraghan, P. et al. (2014). Empirical Failure-Analysis of a Large-Scale Cloud Computing System. IEEE ISSRE.
- Eling, M. & Wirfs, J. (2015). Modelling and Management of Cyber Risk. IAALS Oslo.
- He, Y. et al. Cyber Risk Insurance Pricing Based on Optimised Portfolios. University of Waterloo.
Rudy Prasetiya
IT GRC, cybersecurity & audit practitioner. Writes about controls that actually hold.