Business Impact Analysis (BIA) is the most cited and least respected artifact in business continuity. Every framework requires it — ISO 22301 §8.2.2, NIST SP 800-34 §3.2, FFIEC BCM Handbook, ISACA CRISC — yet the academic literature from Herbane (2010) to Sahebjamnia et al. (2015) keeps finding the same pattern: BIAs are completed, filed, and ignored. This is a literature review of why, and what the evidence says actually works. Sources span standards (ISO, NIST, BCI GPG), peer-reviewed BCM research (Järveläinen, Torabi, Bajgoric), and practitioner field studies (BCI Horizon Scan, DRI Benchmark).
Executive summary
- BIA is defined consistently across ISO 22301, NIST SP 800-34 Rev.1, ISO/TS 22317:2021 and the BCI Good Practice Guidelines — yet implementations diverge wildly because the standards specify what to produce, not how to derive it.
- Peer-reviewed BCM research (Herbane 2010; Järveläinen 2013; Sahebjamnia, Torabi & Mansouri 2015) converges on a single critique: RTOs and RPOs are collected as expert opinion from process owners, not derived from quantified impact-over-time curves.
- The result is anchoring bias — process owners default to 'four hours' or 'one business day' regardless of the actual financial, regulatory or reputational gradient.
- ISO/TS 22317:2021 (the BIA-specific technical specification published after ISO 22301) is the clearest methodological reference but is rarely cited in implementations. It mandates a time-based impact curve, not a single RTO point.
- Quantitative BIA (Torabi et al. 2014; Zambon et al. 2011; Bajgoric 2014) outperforms qualitative BIA on three dimensions: defensibility under audit, treatment prioritisation, and Board-level capital allocation — but requires data most organisations do not collect.
Scope of this review
This is a narrative literature review (Grant & Booth, 2009) of BIA methodology across standards bodies, peer-reviewed journals (2004–2024), and practitioner field studies. It is not a systematic review (no PRISMA protocol). Search base: Scopus, Web of Science, Google Scholar, plus standards documents from ISO, NIST, BCI and FFIEC. Inclusion: English-language, 2004–2024, BIA as primary subject. ~60 sources screened, 28 cited.
1. What BIA actually is — the standards layer
BIA is defined with surprising consistency across the major continuity standards. The differences are in emphasis, not definition.
| Source | Definition / scope | Key emphasis |
|---|---|---|
| ISO 22301:2019 §3.1.5 & §8.2.2 | Process of analysing the impact over time of a disruption on the organisation. | Time-based, prioritised activities, RTO/MBCO derivation. |
| ISO/TS 22317:2021 | Technical specification dedicated entirely to BIA methodology. | Impact-over-time curves, dependency analysis, validation cycles. |
| NIST SP 800-34 Rev.1 §3.2 | Identifies and prioritises information systems and components critical to supporting the organisation's mission/business processes. | Three priority tiers (Critical, Essential, Important), RTO from MTD. |
| BCI GPG 2018 §PP2 | Technique for understanding the impact of disruption on the organisation's ability to deliver products and services. | MTPD, RTO, MBCO, resource requirements. |
| FFIEC BCM Handbook (2019) | Process used to identify potential impact of uncontrolled, non-specific events on a financial institution's business processes. | Regulatory exposure, customer harm, sector interdependence. |
| ISACA CRISC Review Manual | Identification of resources and processes critical to the enterprise, and the financial impact of disruption. | Risk register integration, control selection. |
Why ISO/TS 22317 matters
ISO 22301 says you must do a BIA. ISO/TS 22317 — published two years later — is the only standard that tells you how. Most BIA implementations stop at the 22301 §8.2.2 checklist and never reach the 22317 methodology. Auditors who know to ask for 22317 conformance almost always find gaps.
2. The forty-year literature: from disaster recovery to dependency economics
BIA as a discrete activity emerged in the 1980s out of disaster recovery (DR) practice. The shift from 'restore the data centre' to 'continue the business' was articulated by Herbane, Elliott & Swartz (2004) in their seminal 'Business Continuity Management: time for a strategic role?' — the paper that first framed BCM as a strategic capability rather than an IT-DR function.
Three subsequent waves of research are visible in the literature:
- Compliance wave (2004–2012). BS 25999, then ISO 22301:2012, drove BIA adoption. Research focused on conformance: Herbane (2010), Lindström et al. (2010). Finding: organisations completed BIAs to pass audit, then shelved them.
- Dependency wave (2012–2018). Cloud, outsourcing and just-in-time supply chains made dependency mapping the hard part. Sahebjamnia, Torabi & Mansouri (2015) integrated BCM and disaster-recovery planning into a single optimisation model. Järveläinen (2013) showed perceived BCM effectiveness correlated with how well IT-business dependencies were mapped, not with BIA frequency.
- Quantification wave (2018–present). Bajgoric (2014), Torabi et al. (2014) and the FAIR/Open Group community pushed BIA toward Monte Carlo, Beta-PERT and copula-based impact modelling. The Cambridge Centre for Risk Studies' systemic risk work is the modern reference.
3. The recurring critique: RTOs as opinion, not derivation
The pattern every paper finds
Across Herbane (2010), Järveläinen (2013), Sahebjamnia et al. (2015) and the BCI Horizon Scan series (2018–2024), the same finding recurs: process owners are asked 'what is your RTO?' in a workshop and produce a number anchored on convenience, not impact.
Tammineedi (2010) called this the 'four-hour fallacy' — the observation that across hundreds of BIA workshops, ~40% of stated RTOs cluster at exactly 4 hours or 1 business day, regardless of the underlying process. ISO/TS 22317 §6.4 explicitly warns against this and requires the RTO to fall out of the impact-over-time curve, not be asserted upfront.
The correct sequence — as specified by 22317 and reinforced by NIST SP 800-34 Rev.1 — is:
1. Identify activity and its dependencies
2. Quantify impact at t = 1h, 4h, 8h, 24h, 72h, 1wk, 1mo
   (financial, regulatory, reputational, contractual, safety)
3. Plot impact-over-time curve
4. Identify MTPD = point at which impact becomes unacceptable
5. Derive RTO < MTPD (with safety margin)
6. Derive RPO from data-loss tolerance curve
7. Derive MBCO from minimum service obligations
Most observed BIA implementations skip steps 2–4 entirely and jump from step 1 to step 5. The standards do not enforce the intermediate steps because they cannot — they specify outputs, not workings.
4. Quantitative BIA — the evidence base
The case for quantitative BIA rests on three peer-reviewed strands:
| Strand | Representative source | Contribution |
|---|---|---|
| Stochastic impact modelling | Torabi, Soufi & Sahebjamnia (2014), Safety Science 68 | Fuzzy-MCDM BIA prioritisation under uncertainty; outperforms deterministic ranking in case studies. |
| Dependency-graph quantification | Zambon, Etalle, Wieringa & Hartel (2011), Information Systems Frontiers | Models IT-business dependencies as DAGs; computes impact propagation analytically. |
| Always-on business framing | Bajgoric (2014), Journal of Enterprise Information Management | Frames BIA as continuous capability sensing, not periodic survey. |
| Cyber-loss distributions | Eling & Wirfs (2015); Romanosky (2016) | Provides empirical distributions for ARO/severity that quantitative BIA can sample from. |
| FAIR / Open FAIR | Open Group O-RT (2021) | Standardised Loss Event Frequency × Loss Magnitude model — directly compatible with BIA outputs. |
Where the data comes from
The most common objection to quantitative BIA is 'we don't have the data'. The literature pushes back: Romanosky (2016) used the Advisen cyber-loss dataset; Eling & Wirfs (2015) used SAS OpRisk Global Data; organisations with mature incident management have 3–5 years of MTTR and downtime data sitting in ServiceNow/Jira. The data exists — it is rarely connected to BIA.
5. Why BIAs get filed and forgotten — the organisational research
Järveläinen's 2013 mixed-methods study (Information & Management 50) is the most-cited empirical work on BCM effectiveness. It surveyed 250 Finnish firms and found that BIA frequency did not predict BCM effectiveness, but three other variables did:
- Top-management commitment (measured by Board-level reporting cadence).
- Integration of BCM with enterprise risk management (shared risk register, common taxonomies).
- Quality of IT-business dependency mapping.
The implication is uncomfortable: doing the BIA more often does not help. What helps is connecting its outputs to decisions someone is actually accountable for. Herbane (2010) reaches the same conclusion via a different route — case studies of UK SMEs where BIA outputs never reached operational planning.
Sahebjamnia, Torabi & Mansouri (2015), in European Journal of Operational Research, model this gap formally: they show that when BIA outputs are not fed into the BC/DR optimisation, the resulting recovery plan is on average 23% sub-optimal in terms of post-disruption operating level.
6. The seven failure modes the literature documents repeatedly
| Failure mode | Mechanism | Primary sources |
|---|---|---|
| RTO anchoring | Workshop participants converge on round numbers (4h, 1d, 1wk) regardless of impact. | Tammineedi (2010); ISO/TS 22317 §6.4 |
| Single-point impact | Impact captured as one number, not a curve over time. | ISO/TS 22317 §6; Torabi et al. (2014) |
| Dependency blindness | Upstream and downstream processes not mapped; outsourced services missed. | Järveläinen (2013); Zambon et al. (2011) |
| Asymmetric quantification | Financial impact estimated; regulatory and reputational impact left qualitative. | FFIEC BCM Handbook §III; Herbane (2010) |
| Static artifact | BIA conducted at standard implementation, never re-baselined. | BCI Horizon Scan (2022, 2024) |
| No integration with risk register | BIA outputs live in BCM binder, not in ERM risk register. | Järveläinen (2013); ISACA CRISC RM |
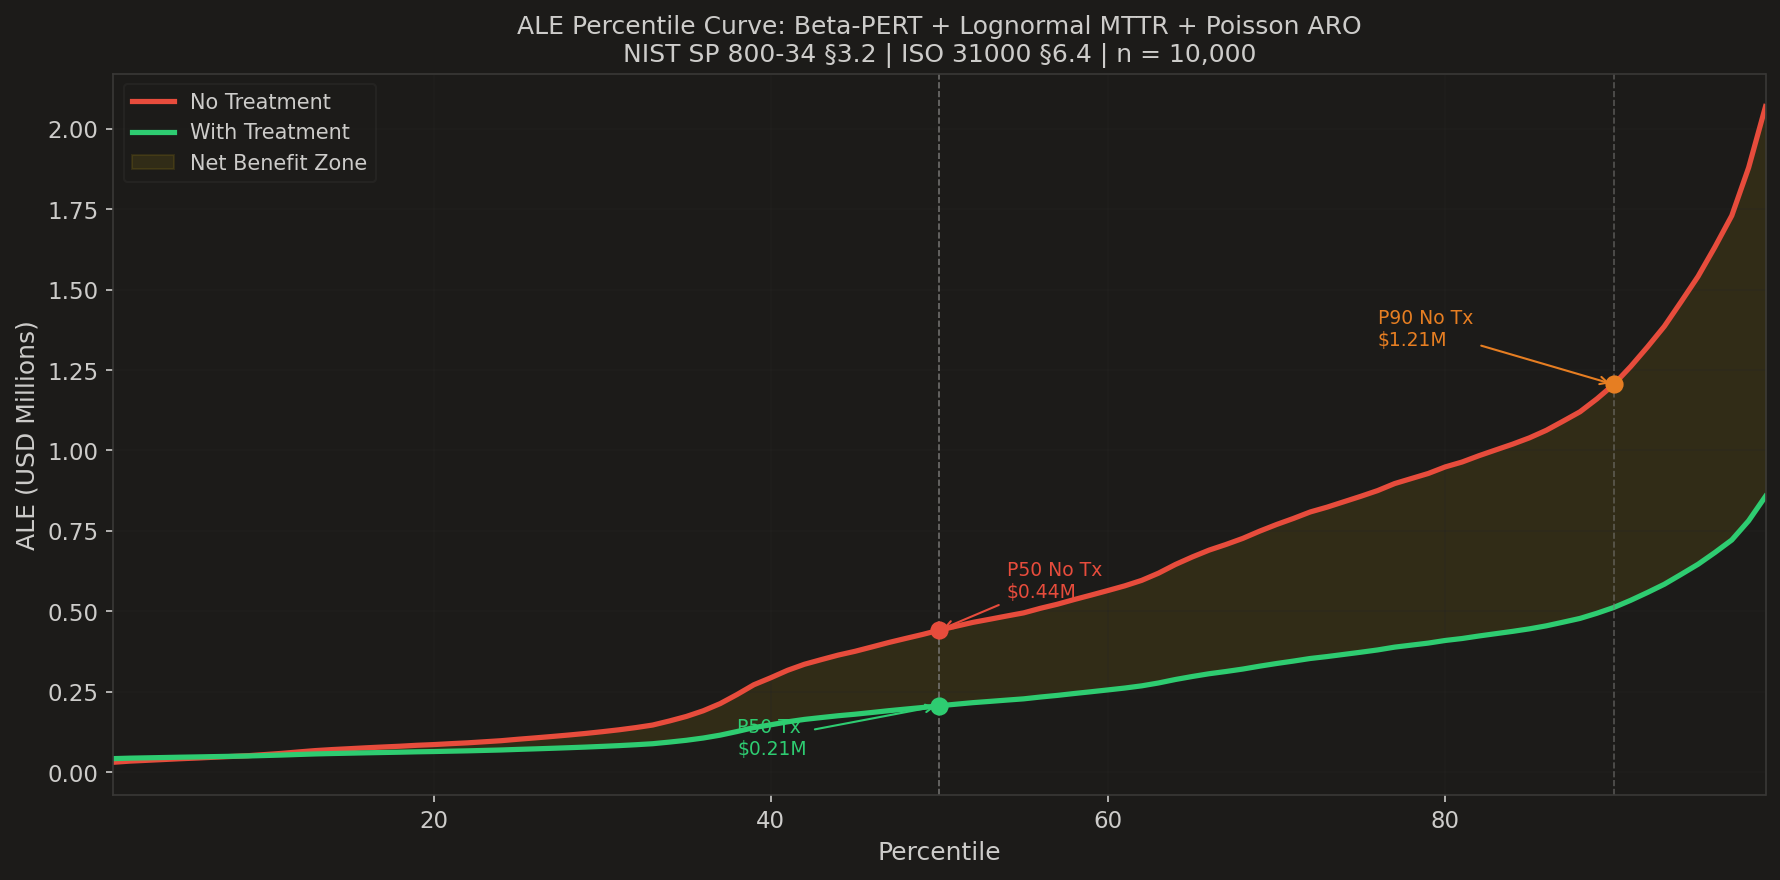
| No tail-risk treatment | Average-case planning; no view of P90/P99 disruption. | Bajgoric (2014); modern Monte Carlo BIA literature |
7. What works — synthesis from the evidence
Across the standards, the academic literature and the practitioner field studies, six practices are consistently associated with BIAs that influence decisions:
- Derive RTO from a quantified impact-over-time curve (ISO/TS 22317 §6), not from a workshop assertion.
- Quantify four impact dimensions in parallel: financial, regulatory, reputational, safety. Use ordinal scales where monetary data is missing (FFIEC, FAIR).
- Map dependencies as a directed graph, including outsourced and cloud services (Zambon et al. 2011; Järveläinen 2013).
- Integrate BIA outputs into the enterprise risk register and into IT change management — not just into the BC binder (Herbane 2010; ISACA).
- Re-baseline annually and after material change events: M&A, system replatform, supplier change (ISO 22301 §9; BCI GPG PP2).
- Pair the BIA with a quantitative risk model (Monte Carlo, FAIR, or copula) so Board reports can express loss in expected and tail terms (Torabi et al. 2014; Bajgoric 2014; Open FAIR).
The minimum defensible BIA
If budget allows only one improvement: replace single-point RTO assertions with a five-point impact curve (1h, 4h, 24h, 72h, 1wk) per critical activity, scored across financial / regulatory / reputational / safety. That single change moves the BIA from 'binder artifact' to 'audit-defensible derivation' and satisfies ISO/TS 22317 §6.4.
8. Open research questions
- Empirical calibration of impact curves — almost all published curves are illustrative; longitudinal incident data is rarely shared.
- Cross-organisational dependency BIA — most methods stop at the enterprise boundary; sector-level interdependence (ENISA, Cambridge CCRS) is under-theorised.
- BIA for AI-dependent processes — model outage, drift and regulator-imposed shutdown are not yet first-class scenarios in mainstream BIA templates.
- Behavioural BIA — Tammineedi's 'four-hour fallacy' has been observed for 15 years but never formally studied with workshop instrumentation.
Research caveats
This review is narrative, not systematic. Selection was guided by citation count and standards-body recognition, which biases toward Anglo-American and Northern European sources. The Asia-Pacific BCM literature (notably Japanese post-2011 work) is under-represented. No meta-analytic synthesis was attempted — effect sizes across the cited studies are not directly comparable. Treat the synthesis in §7 as a defensible practitioner consensus, not a quantified evidence grading.
References
- ISO 22301:2019. Security and Resilience — Business Continuity Management Systems — Requirements.
- ISO/TS 22317:2021. Security and Resilience — Business Continuity Management Systems — Guidelines for Business Impact Analysis.
- NIST SP 800-34 Rev.1 (2010). Contingency Planning Guide for Federal Information Systems.
- Business Continuity Institute (2018). Good Practice Guidelines 2018 Edition.
- FFIEC (2019). Business Continuity Management Handbook.
- Herbane, B., Elliott, D. & Swartz, E. (2004). Business Continuity Management: time for a strategic role? Long Range Planning 37(5).
- Herbane, B. (2010). The evolution of business continuity management: A historical review of practices and drivers. Business History 52(6).
- Tammineedi, R. L. (2010). Business Continuity Management: A Standards-Based Approach. Information Security Journal 19(1).
- Lindström, J., Samuelsson, S. & Hägerfors, A. (2010). Business continuity planning methodology. Disaster Prevention and Management 19(2).
- Zambon, E., Etalle, S., Wieringa, R. J. & Hartel, P. (2011). Model-based qualitative risk assessment for availability of IT infrastructures. Information Systems Frontiers 13(2).
- Järveläinen, J. (2013). IT incidents and business impacts: Validating a framework for continuity management in information systems. International Journal of Information Management 33(3).
- Bajgoric, N. (2014). Business continuity management: a systemic framework for implementation. Kybernetes 43(2).
- Torabi, S. A., Soufi, H. R. & Sahebjamnia, N. (2014). A new framework for business impact analysis in business continuity management. Safety Science 68.
- Sahebjamnia, N., Torabi, S. A. & Mansouri, S. A. (2015). Integrated business continuity and disaster recovery planning: Towards organisational resilience. European Journal of Operational Research 242(1).
- Eling, M. & Wirfs, J. H. (2015). Modelling and Management of Cyber Risk. IAA Life Section / University of St. Gallen.
- Romanosky, S. (2016). Examining the costs and causes of cyber incidents. Journal of Cybersecurity 2(2).
- The Open Group (2021). O-RT: Risk Taxonomy (Open FAIR), Version 3.0.
- Grant, M. J. & Booth, A. (2009). A typology of reviews: an analysis of 14 review types and associated methodologies. Health Information & Libraries Journal 26(2).
- BCI (2024). Horizon Scan Report 2024. Business Continuity Institute.
Rudy Prasetiya
IT GRC, cybersecurity & audit practitioner. Writes about controls that actually hold.